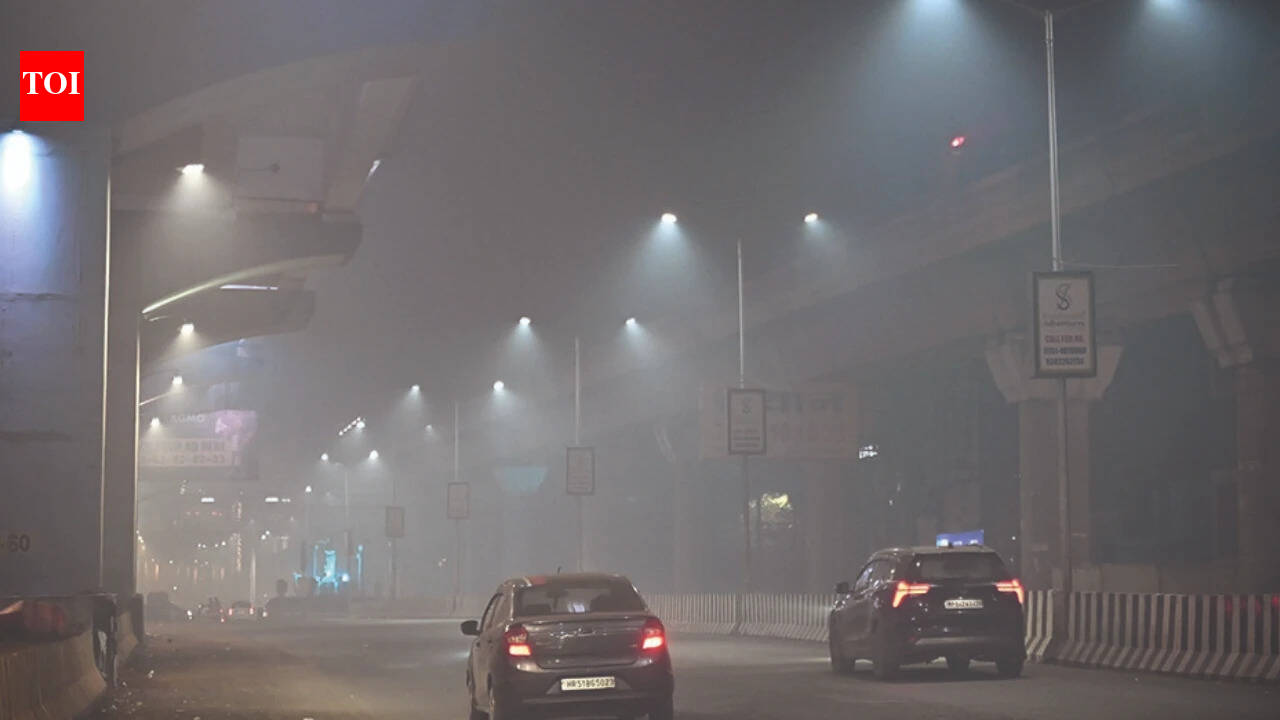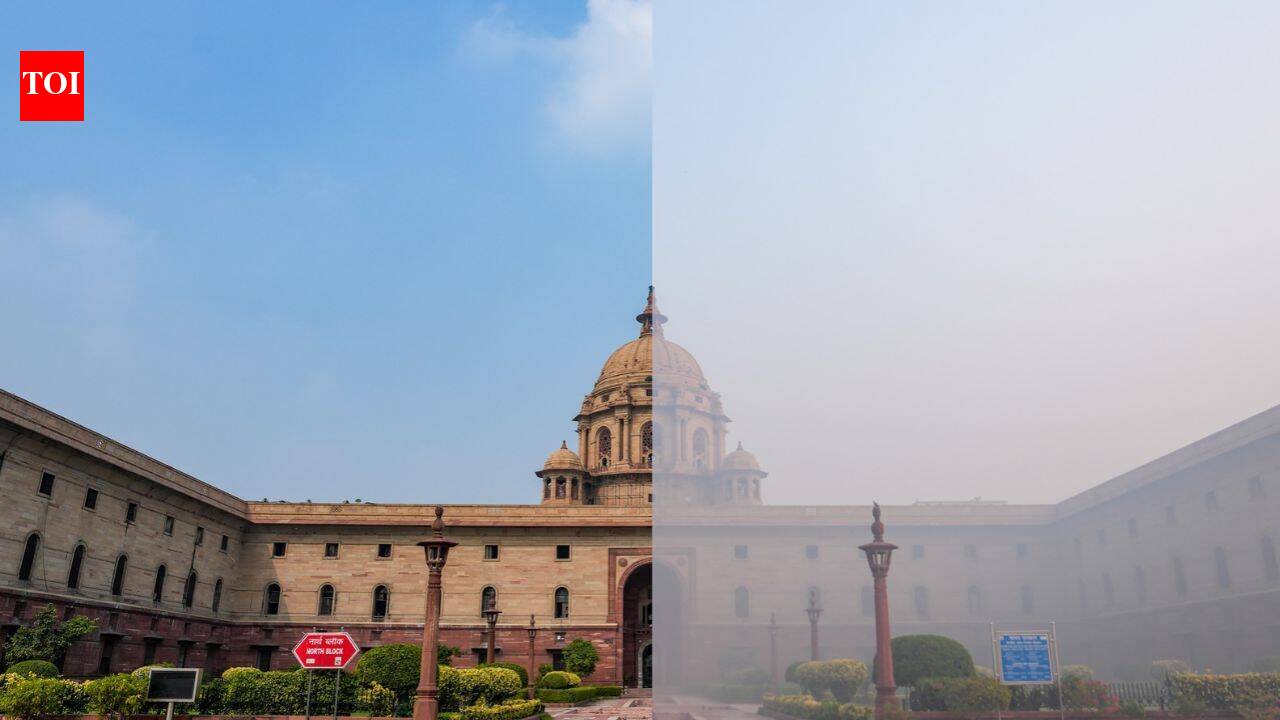
NEW DELHI: Social media was flooded with screenshots of air quality apps showing Delhi’s Air Quality Index (AQI) touching 1,500 to 1,800 on Diwali night, even as the official figures shared by the Central Pollution Control Board (CPCB) remained below 400.The discrepancy has raised questions about how different platforms calculate air pollution levels and why their readings vary so widely.While India’s National Air Quality Index (NAQI), used by CPCB, is capped at 500, several international platforms follow methodologies based on the US Environmental Protection Agency (EPA), which does not impose the same upper limit.But beyond the difference in AQI scores, pollution monitoring data from Delhi showed just how severe the spike in particulate matter was after firecrackers were set off on Diwali night.TOI explains how different AQI methodologies work, why readings vary and what pollution monitoring stations recorded across the capital.
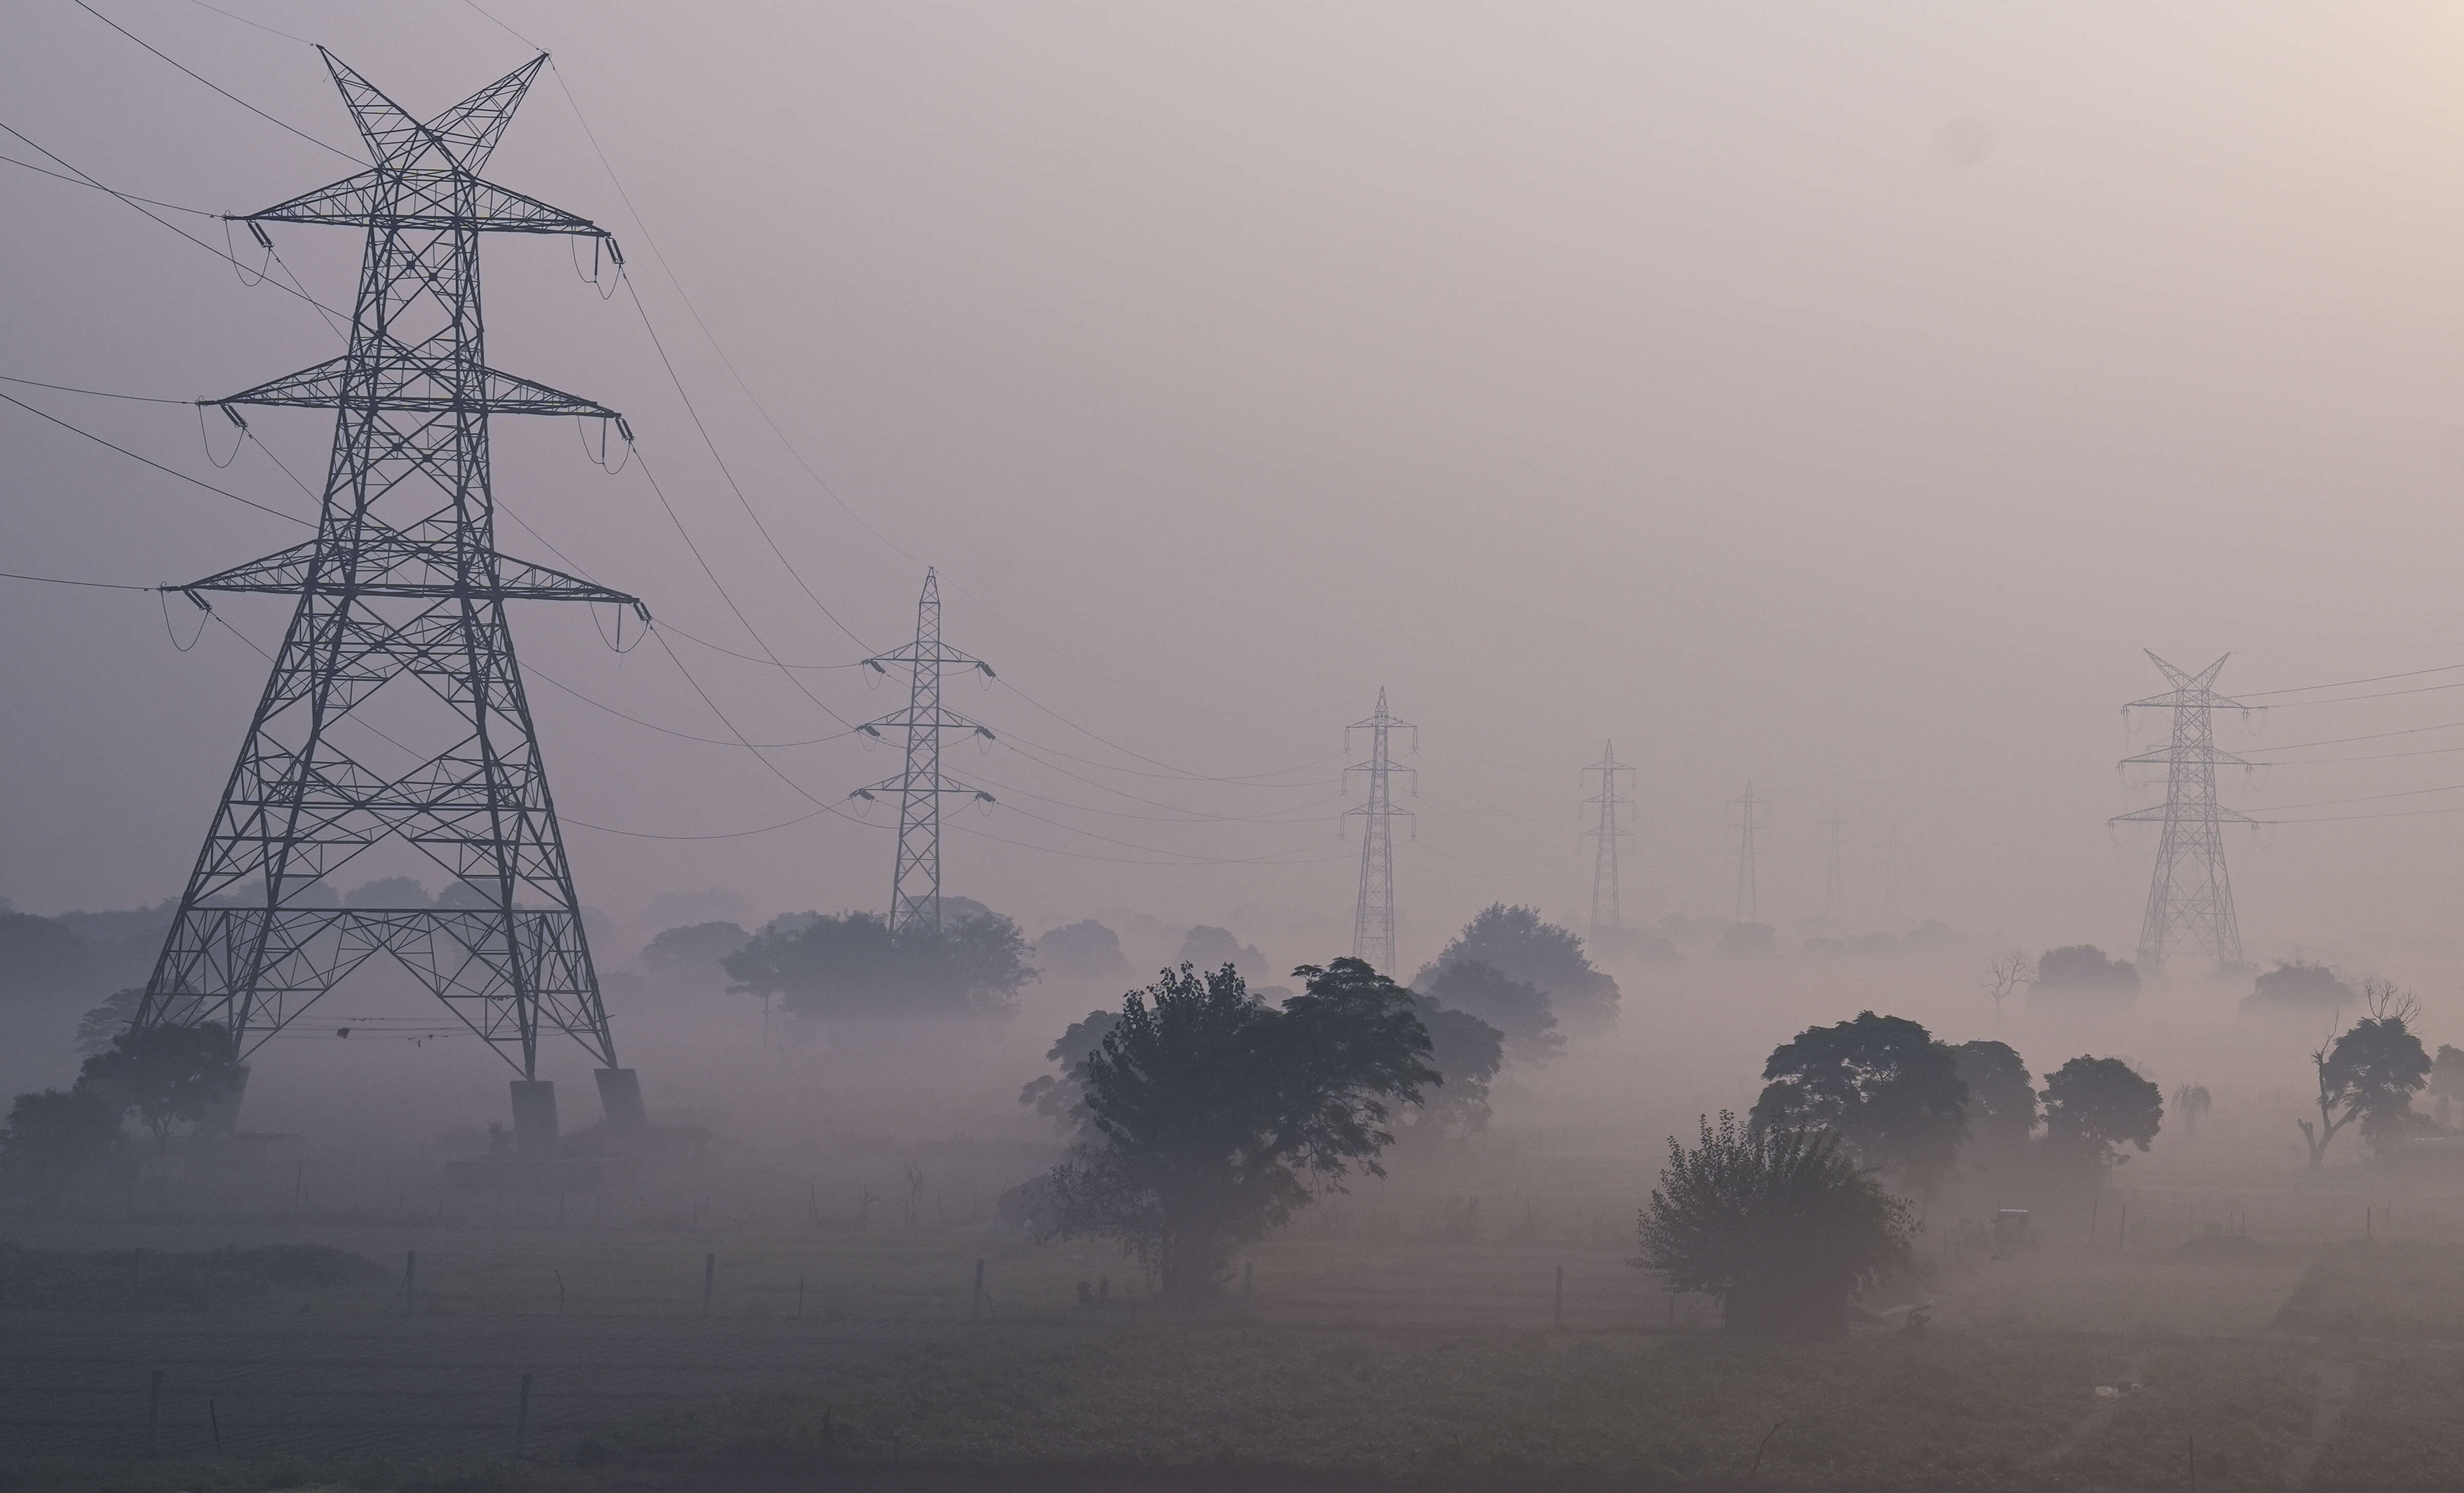
A thick layer of smog engulfs an area near the Yamuna river in New Delhi. (PTI Photo)
How is AQI calculated?
The Air Quality Index measures the concentration of major air pollutants, including:
- Particulate matter (PM2.5 and PM10)
- Ground-level ozone (O₃)
- Carbon monoxide (CO)
- Sulphur dioxide (SO₂)
- Nitrogen dioxide (NO₂)
For each pollutant, predetermined concentration limits, known as breakpoints, are used to convert measured pollution levels into an AQI score. The score is then assigned to a category indicating the severity of air pollution.India’s AQI has six categories, ranging from Good (0-50) to Severe (401-500). The US system also has six categories, but its uppermost category, Hazardous, has no equivalent 500-point ceiling.
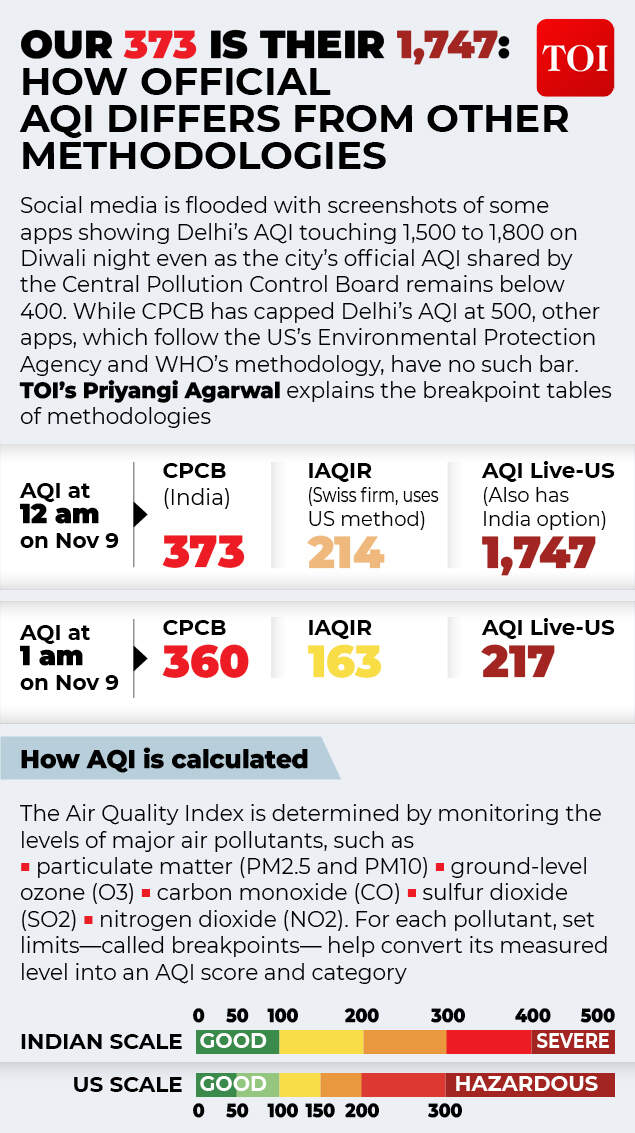
How AQI is calculated
This means that while India’s system stops displaying increasingly high pollution levels beyond 500, platforms following the US methodology can continue assigning higher numerical scores.The concentration at which a pollutant enters a particular category also varies between the two systems. A lower breakpoint means that the category is reached at a lower pollutant concentration.
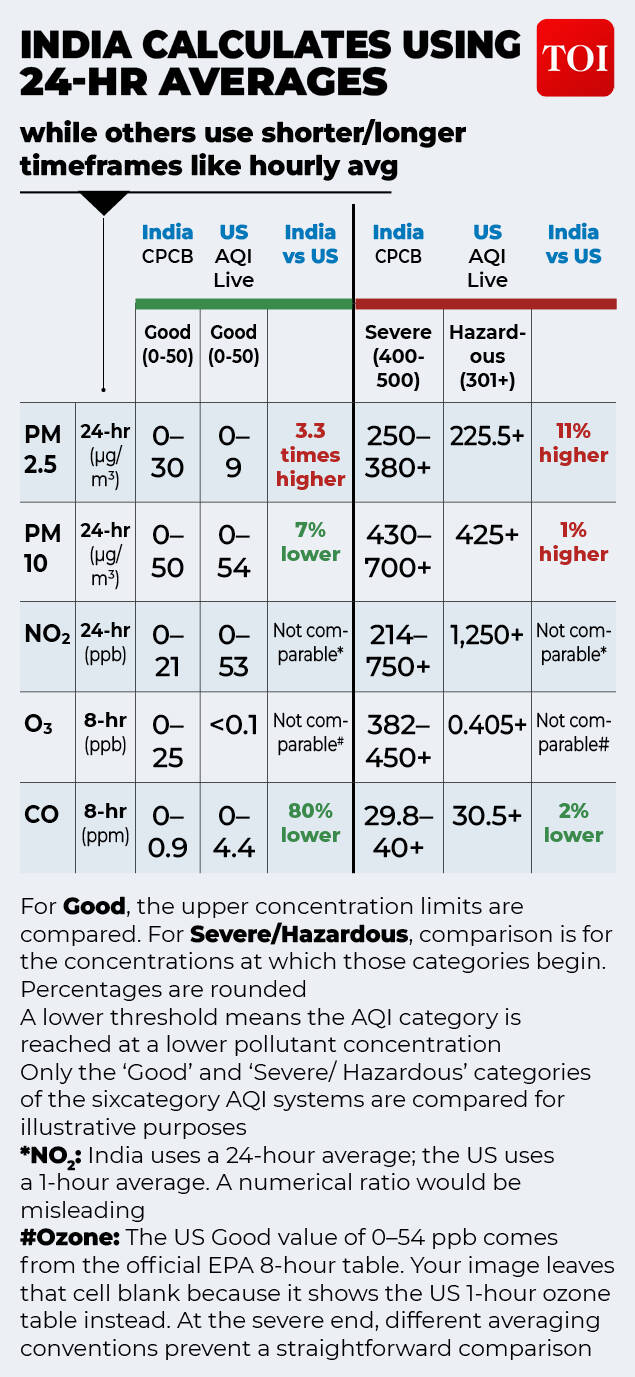
India calculates using 24-hr averages
For instance, the upper concentration limits under the Good category and the concentrations at which the Severe or Hazardous categories begin are not identical across the two methodologies.However, a direct comparison requires accounting for differences in pollutant averaging periods. India generally uses 24-hour averages for several pollutants, while the US system uses different averaging periods, including one-hour and eight-hour averages for certain pollutants.Nitrogen dioxide, for example, is assessed using a 24-hour average in India and a one-hour average in the US. Comparing the numerical thresholds without accounting for these differences can be misleading.Similarly, the US EPA’s Good-category ozone breakpoint is based on an eight-hour concentration table, rather than its one-hour table.
Jahangirpuri’s PM2.5 hits 4,985, DPCC later revises reading
The hourly PM2.5 concentration at northwest Delhi’s Jahangirpuri spiked to 4,985 micrograms per cubic metre (µg/m³) at 6 pm and 8 pm on Diwali, before shooting up again at 8 am the next day, making it the most polluted location on Sunday and Monday in the city.This was around 83 times the daily national ambient air quality standard of 60 µg/m³ and over 332 times the World Health Organisation’s (WHO) daily safe guideline of 15 µg/m³.However, the Delhi Pollution Control Committee (DPCC) changed the readings on Monday night, showing that Jahangirpuri had hit its peak PM2.5 level at 776 µg/m³ at Diwali midnight.
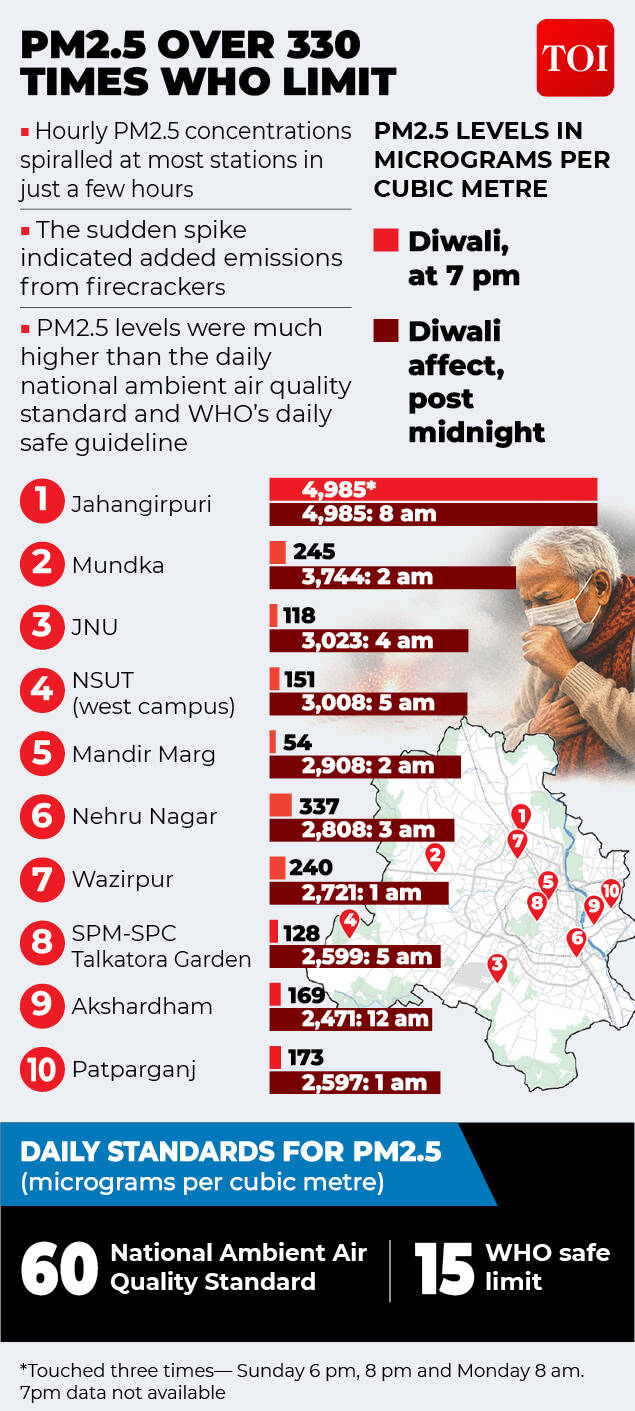
PM 2.5 over 330 times WHO limit
The pattern of extreme pollution around midnight was witnessed in most parts of the city when firecrackers were set off in large numbers.A TOI analysis of DPCC real-time air quality data shows that most monitoring stations witnessed a sharp rise in PM2.5 levels around midnight. Thereafter, pollution levels remained high till at least 6 am on Monday.At Mundka, hourly PM2.5 levels jumped from 245 µg/m³ at 7 pm on Diwali to 3,744 µg/m³ at 2 am on Monday. A similar trend was witnessed across the city.JNU saw a peak hourly PM2.5 concentration of 3,023 µg/m³ at 4 am on Monday, compared with 118 µg/m³ at 7 pm on Sunday. The peak reading at NSUT (west campus) was 3,008 µg/m³, while Mandir Marg recorded 2,908 µg/m³.
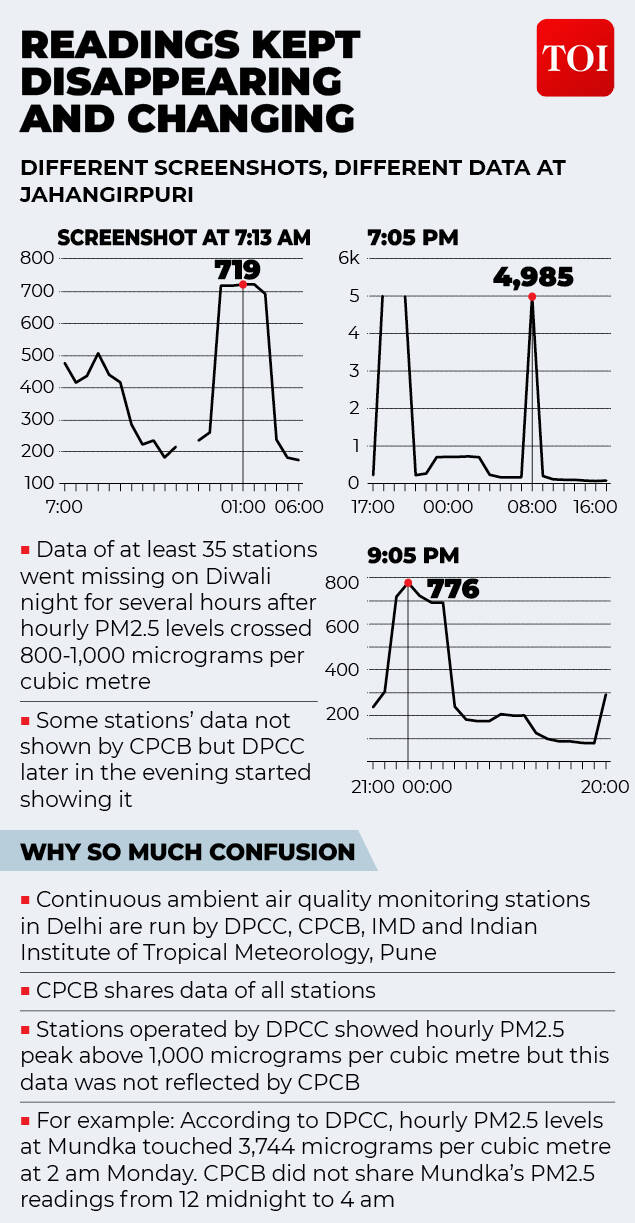
Readings kept disappearing and changing
Other stations that recorded hazardous hourly PM2.5 levels included Nehru Nagar in Lajpat Nagar (2,808 µg/m³), Wazirpur (2,721), Talkatora Garden (2,599), CWG Sports Complex in Akshardham (2,471), Patparganj (2,597) and Ashok Vihar (2,589).
PM10 levels also soar across Delhi
Several locations in Delhi also recorded high hourly PM10 concentrations.At Punjabi Bagh, PM10 reached 4,697 µg/m³, nearly 47 times the daily national ambient air quality standard of 100 µg/m³. It was more than 104 times WHO’s daily safe guideline of 45 µg/m³.Hourly PM10 concentrations also surged to 3,490 µg/m³ at Anand Vihar, 3,929 at Patparganj, 2,881 at RK Puram, 2,879 at Nehru Nagar and 2,671 at Wazirpur.
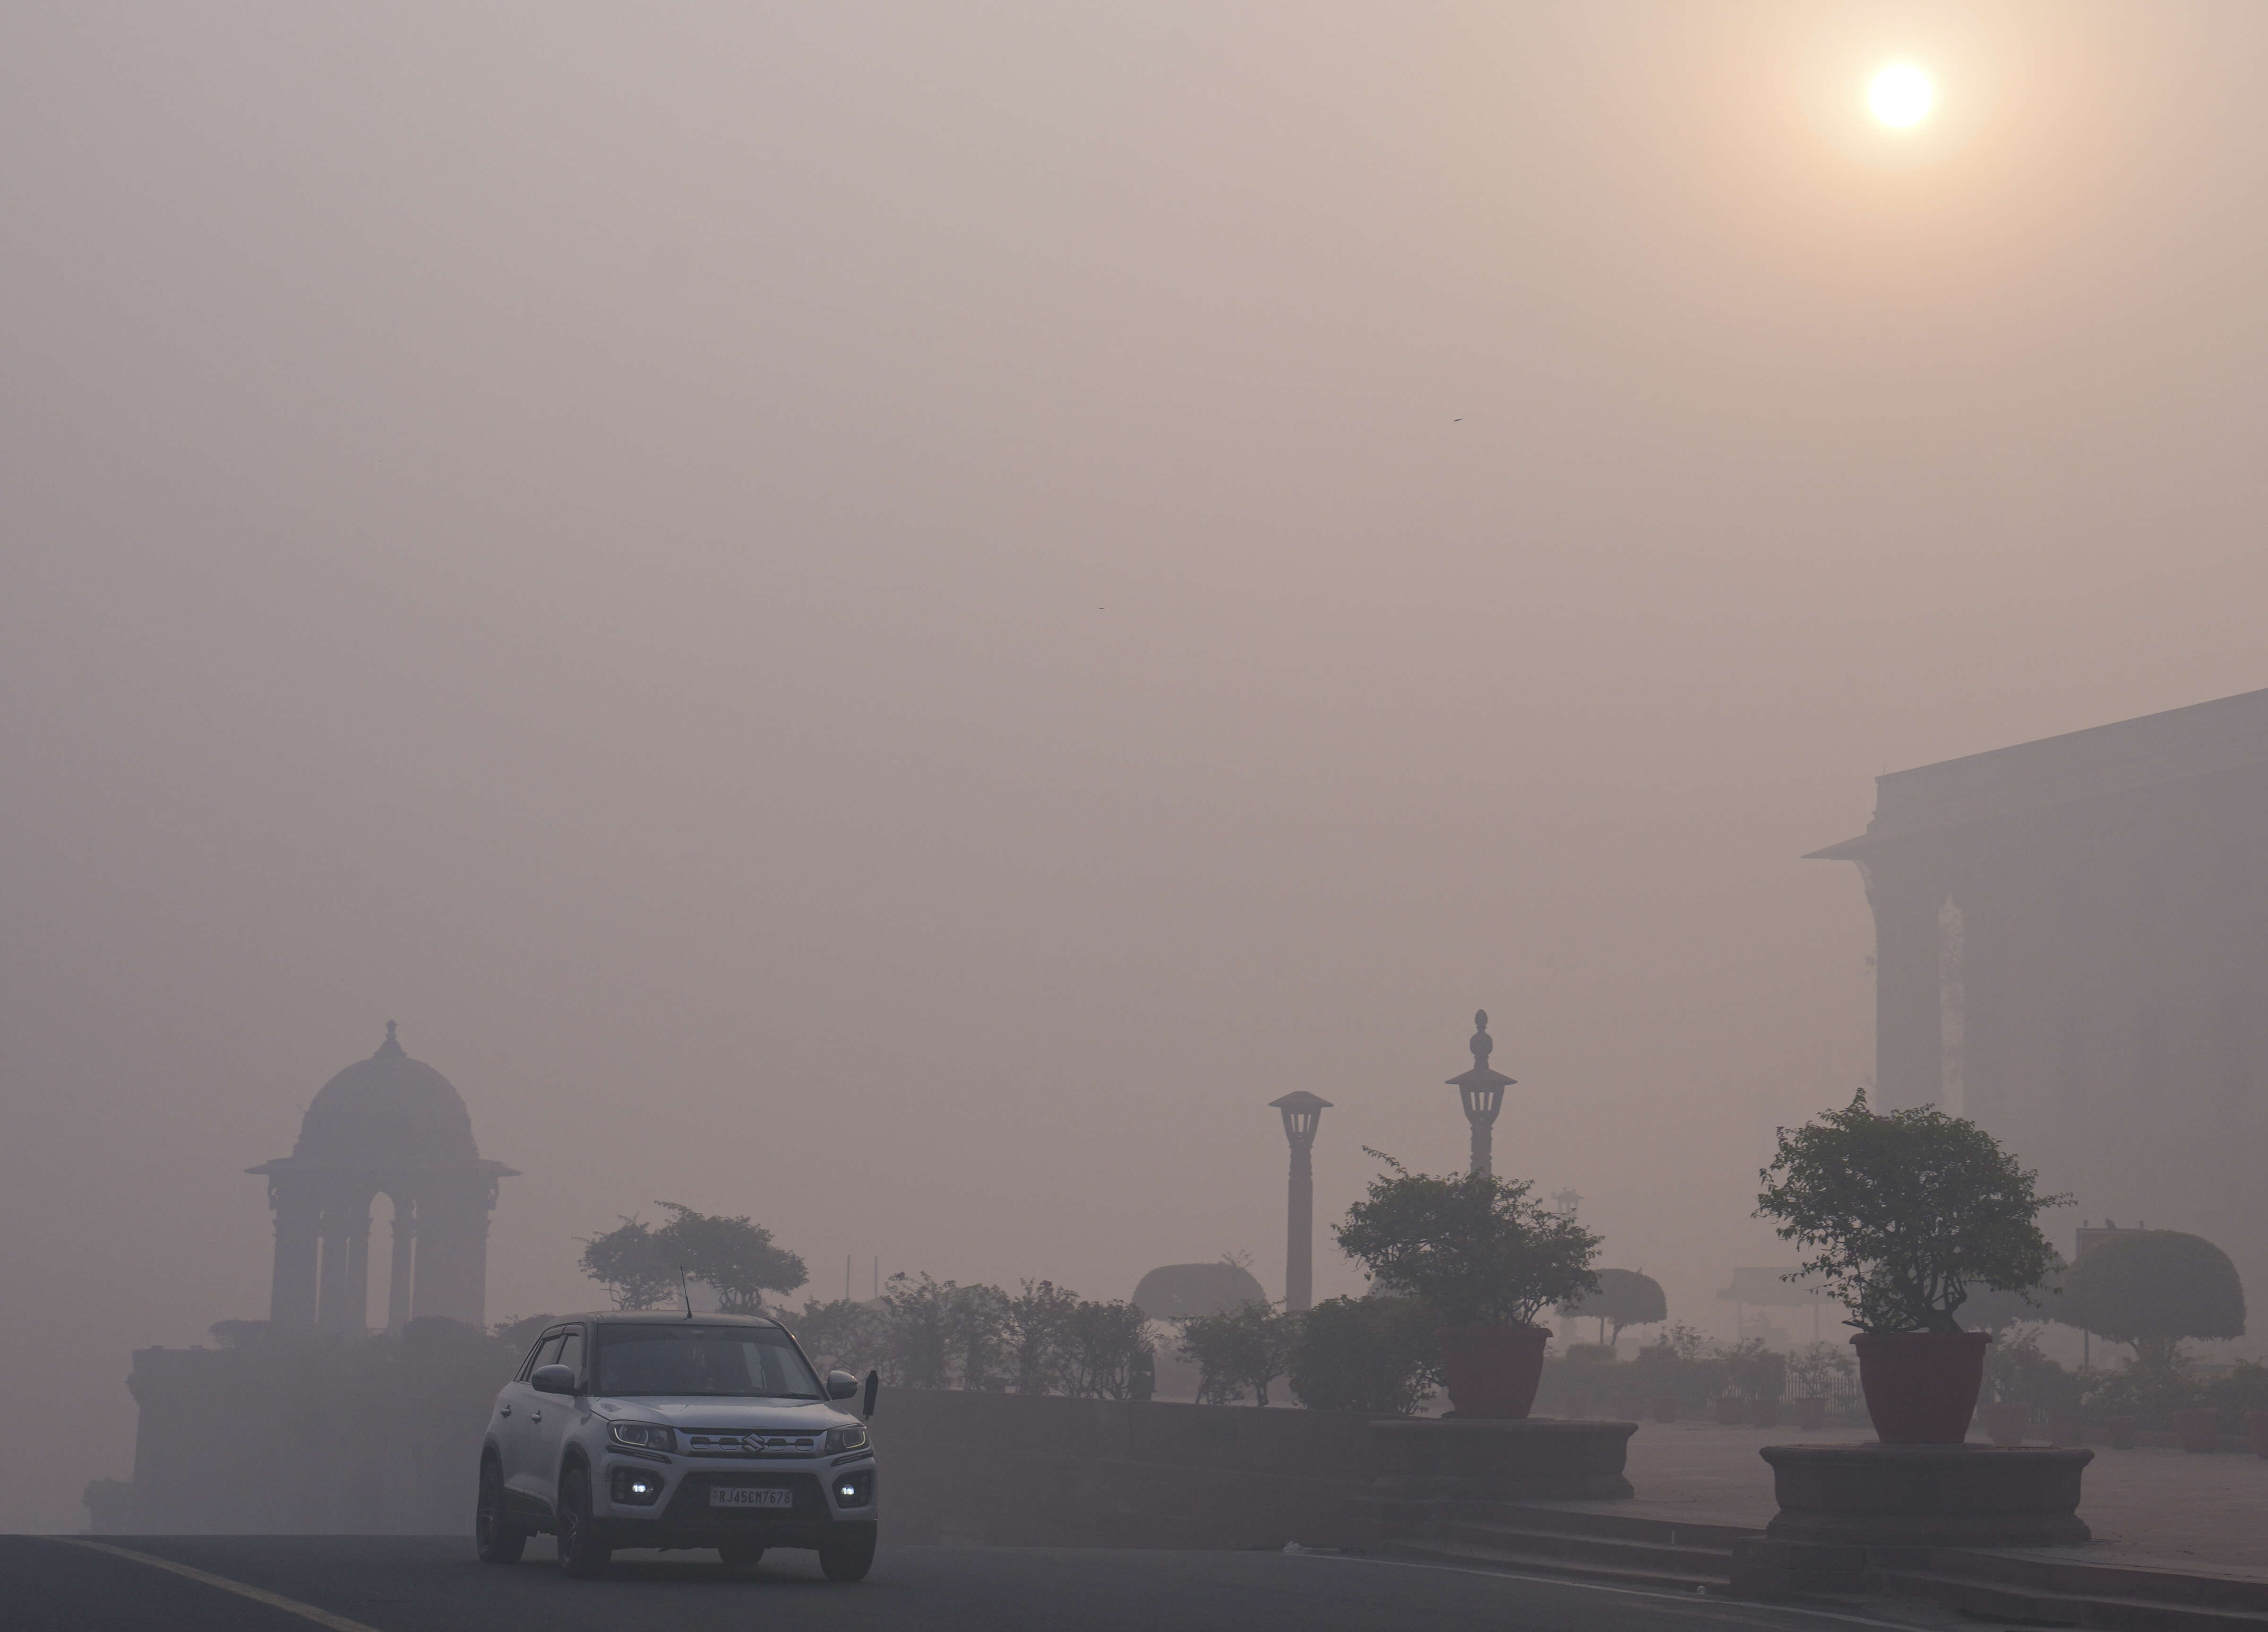
Image Credit: PTI
Sunil Dahiya, founder of think tank Envirocatalyst, said, “Through Diwali night, people across Delhi inhaled PM2.5 averaging 450 to 550 µg/m³. That is eight to nine times the national 24-hour standard and 30 to 37 times WHO’s guideline. Even a few hours at these levels can trigger asthma attacks, worsen lung diseases and raise the risk of heart attacks and strokes.”Dahiya said children, the elderly, pregnant women, outdoor workers and people with heart or lung conditions were hit hardest in such situations.“Fine particles reach deep into their lungs and bloodstream, and the coarser PM10 inflames airways and eyes. One night was added to a season in which Delhi’s air was already more than twice the safe limit before a single cracker was burst,” he said.
Why do different apps show different AQI readings?
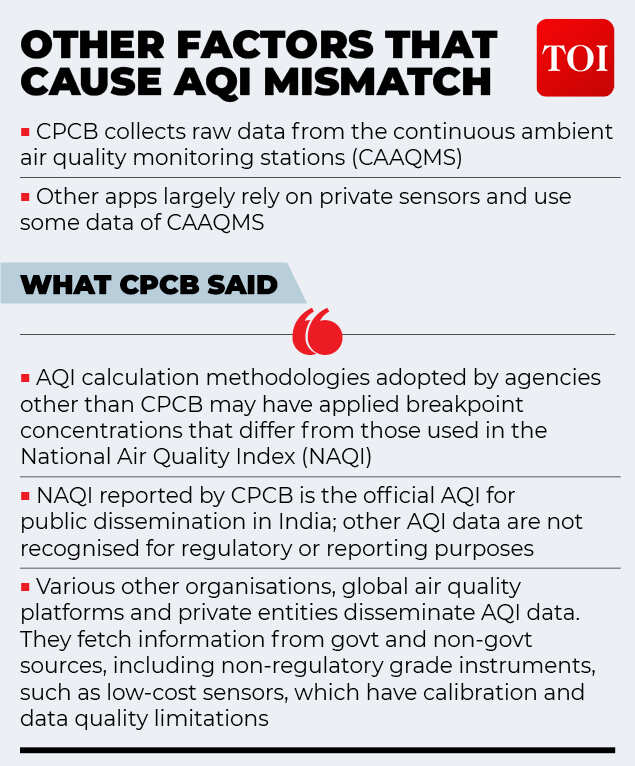
Differences in methodology are not the only reason behind the mismatch. The sources from which platforms obtain pollution data also play a role.CPCB collects raw pollution readings from Continuous Ambient Air Quality Monitoring Stations (CAAQMS), which form part of the official monitoring network.Several private air-quality platforms, meanwhile, rely on a combination of government monitoring stations and privately operated sensors. Some also use readings from non-regulatory-grade instruments, including low-cost sensors.The calibration, accuracy and data quality of these instruments can vary, potentially contributing to differences in the readings displayed by different platforms.The averaging period used to calculate AQI can also affect the final number. An hourly reading may capture a sudden pollution spike, while a 24-hour average smoothens such fluctuations.
What does CPCB say?
CPCB has clarified that AQI methodologies adopted by agencies other than it may use breakpoint concentrations different from those prescribed under India’s National Air Quality Index.It has maintained that the NAQI published by CPCB is India’s official AQI for public dissemination and that other AQI figures are not recognised for regulatory or reporting purposes.
What CPCB said
The board has also pointed out that several global air-quality platforms and private organisations obtain information from both government and non-government sources, including non-regulatory-grade monitoring instruments.Such low-cost sensors may have calibration and data-quality limitations, CPCB said.As a result, readings from different platforms should not be treated as directly interchangeable. A figure exceeding 1,000 on an international app does not necessarily mean CPCB’s official AQI has crossed the same numerical threshold. The two may be measuring and presenting air pollution using different scales, averaging periods and data sources.