NEW DELHI: Social media is flooded with screenshots of some apps showing Delhi’s AQI touching 1,500 to 1,800 on Diwali night even as the city’s official AQI shared by the Central Pollution Control Board remains below 400.While CPCB has capped Delhi’s AQI at 500, other apps, which follow the US’s Environmental Protection Agency and WHO’s methodology, have no such bar. TOI explains the breakpoint tables of methodologiesAQI at 12 am on Nov 9CPCB (India): 373IAQIR (Swiss firm, uses US method): 214AQI Live-US (Also has India option): 1,747AQI on 1pm on Nov 9CPCB: 360IAQIR: 163AQI Live-US: 217
How AQI is calculated
The Air Quality Index is determined by monitoring the levels of major air pollutants, such as:
- Particulate matter (PM2.5 and PM10)
- Ground-level ozone (O₃)
- Carbon monoxide (CO)
- Sulfur dioxide (SO₂)
- Nitrogen dioxide(NO₂)
For each pollutant, set limits—called breakpoints—help convert its measured level into an AQI score and category.Indian scale: 0–50 (Good) | 100 | 200 | 300 | 400–500 (Severe)US Scale: 0–50 (Good) | 100 | 150 | 200 | 300–500 (HazardouS)India calculates using 24-hr averages, while others use shorter/longer timeframes like hourly avg.
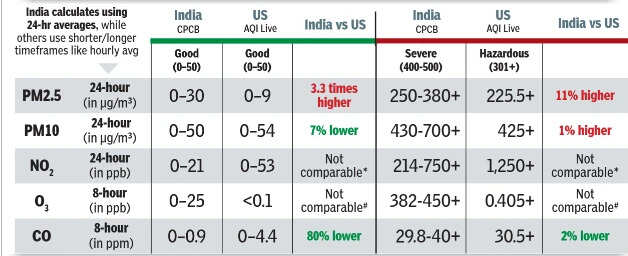
India vs US AQI methodologies comparison
For Good, the upper concentration limits are compared. For Severe/Hazardous, comparison is for the concentrations at which those categories begin. Percentages are rounded.A lower threshold means the AQI category is reached at a lower pollutant concentration.Only the ‘Good’ and ‘Severe/Hazardous’ categories of the six-category AQI systems are compared for illustrative purposes.NO₂: India uses a 24-hour average; the US uses a 1-hour average. A numerical ratio would be misleading.#Ozone: The US Good value of 0–54 ppb comes from the official EPA 8-hour table. Your image leaves that cell blank because it shows the US 1-hour ozone table instead.At the severe end, different averaging conventions prevent a straightforward comparison.
Other factors that cause AQI mismatch
CPCB collects raw data from the continuous ambient air quality monitoring stations (CAAQMS).Other apps largely rely on private sensors and use some data of CAAQMS.
What CPCB said
AQI calculation methodologies adopted by agencies other than CPCB may have applied breakpoint concentrations that differ from those used in the National Air Quality Index (NAQI).NAQI reported by CPCB is the official AQI for public dissemination in India; other AQI data are not recognised for regulatory or reporting purposes.Various other organisations, global air quality platforms and private entities disseminate AQI data.They fetch information from govt and non-govt sources, including non-regulatory grade instruments, such as low-cost sensors, which have calibration and data quality limitations.